Stats
Stats provides an operational view of synchronization health, security posture, storage, and resource usage across the OpenDepot Workshop resources visible to you.
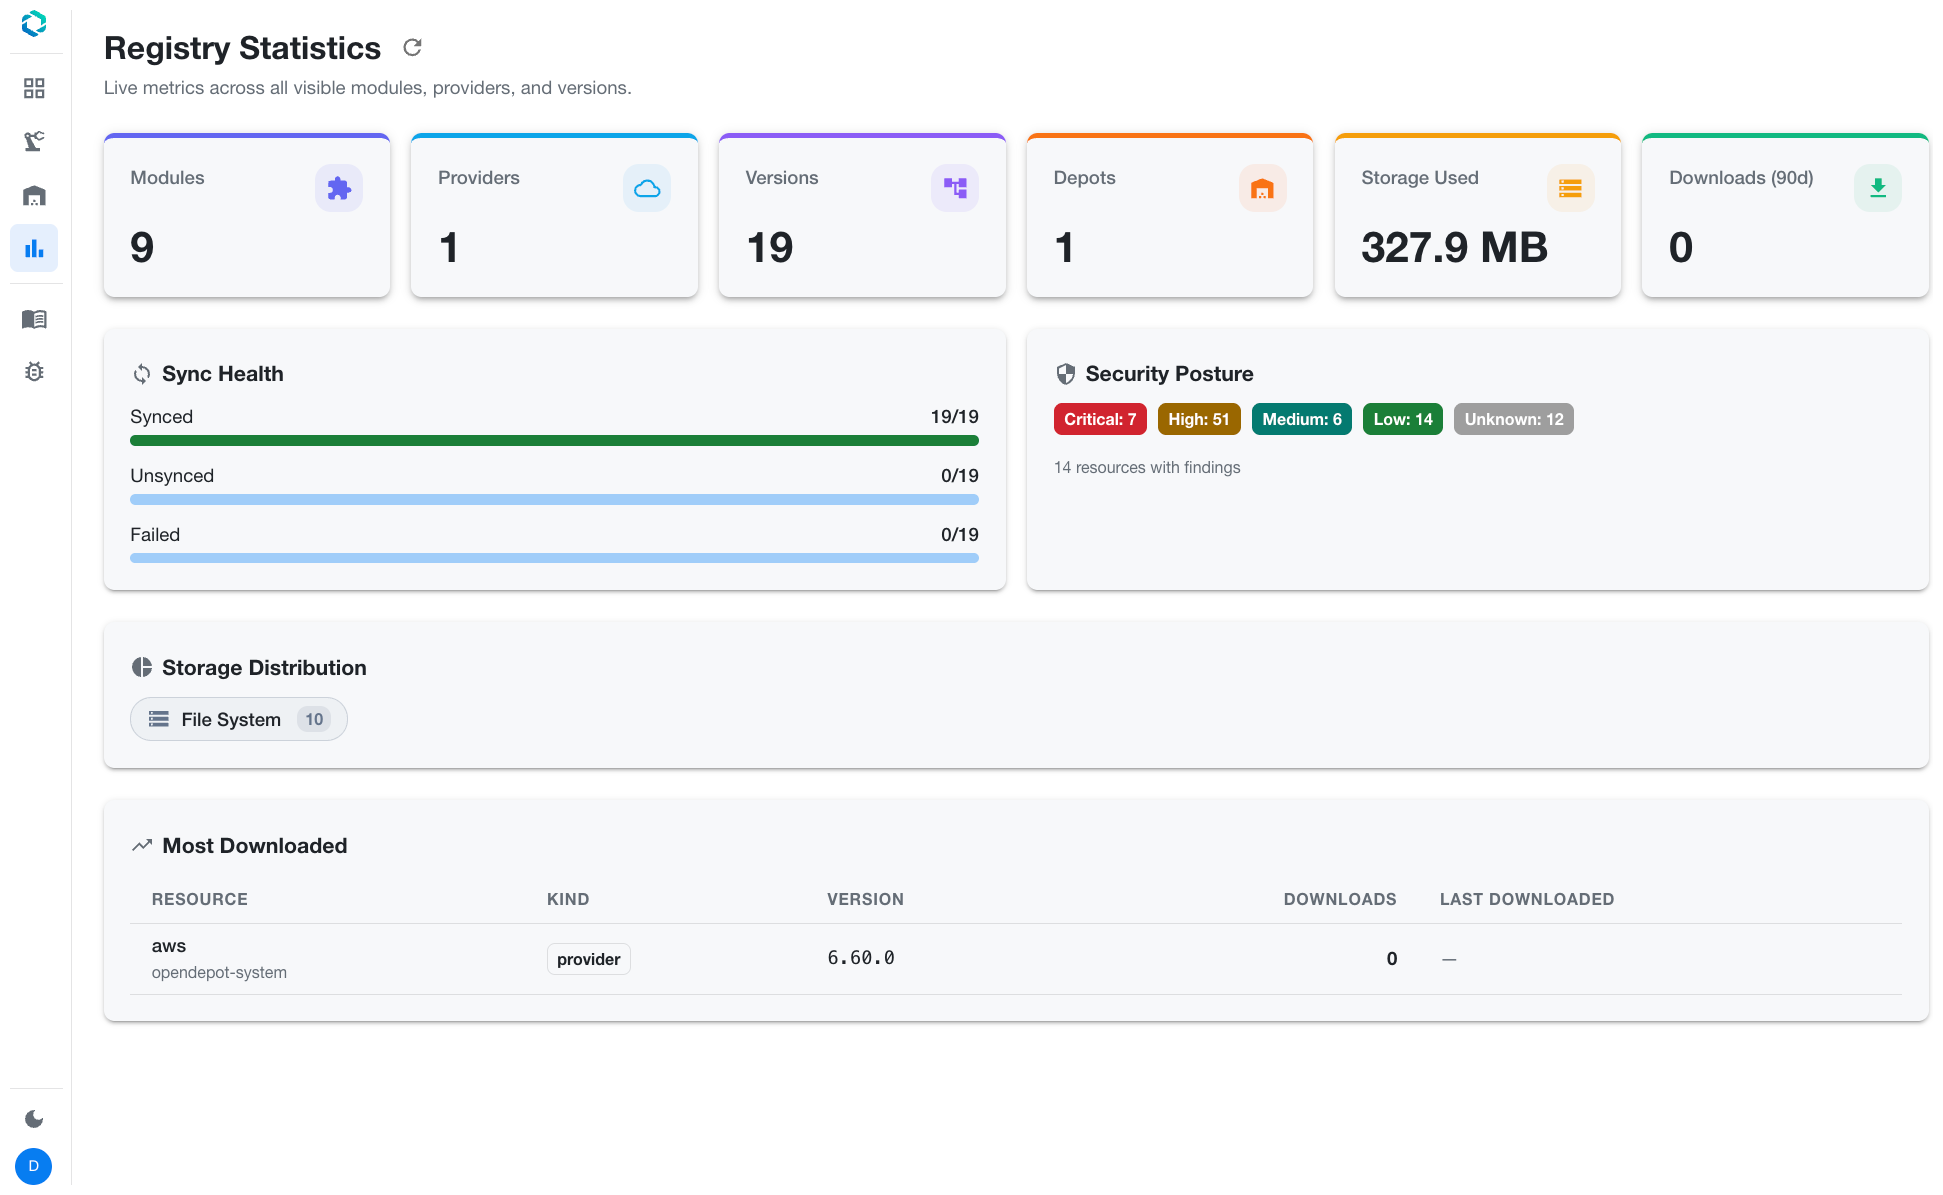
Dashboard
The dashboard (/stats) shows:
| Section | Description |
|---|---|
| Summary cards | Modules, providers, versions, storage, and downloads |
| Sync health | Synced, unsynced, and failed version ratio |
| Security posture | Finding counts by severity |
| Storage distribution | Version counts by backend |
| Most downloaded | Top resources with download totals and timestamps |
Summary counts are computed from Kubernetes CRDs. Download counts come from Prometheus over the configured lookback window and remain available across page loads when the metrics endpoint is being scraped.
Visibility
The dashboard uses the same visibility rules as OpenDepot Workshop. OIDC users with a matching GroupBinding see the resources allowed by that binding.
Download Tracking
Download events are exposed as Prometheus metrics from the Server's /metrics endpoint. Configure the chart's ServiceMonitor or an equivalent scrape configuration, and configure server.stats.prometheusURL when the dashboard must query an existing Prometheus deployment.